
Posted by Pedro Sanchez on Dec 07, 2016
Make PHPStorm your new home - Using Xdebug remotely
In this article we will talk about how to use Xdebug remotely. We will assume that you already know some basic debugging techniques, and also, that you already know how to configure Xdebug. If you missed it, or you just want to refresh your memory, we strongly recommend checking out our previous article about how to configure and use Xdebug locally.
Prerequisites
Firstly, make sure you have Xdebug installed on your server, and that the following settings are specified in the Xdebug ini file:
zend_extension=xdebug.so

xdebug.remote_enable=1
xdebug.remote_host=127.0.0.1
xdebug.remote_port=9000
The next step, is to set and export a variable within your shell profile on the remote server. In the terminal window (already connected to your remote server) type:
If the server uses zsh:
$ vim ~/.zshrc
If the server uses bash:
$ vim ~/.bash_profile
And add this on a new line, anywhere in the file:
export XDEBUG_CONFIG="remote_enable=1 remote_mode=req remote_port=9000 remote_host=127.0.0.1 remote_connect_back=0"
And then, just type:
If the server uses zsh:
$ source ~/.zshrc
If the server uses bash:
$ source ~/.bash_profile
You will need to restart services such as Nginx, Apache and/or FPM on your server to apply these configuration changes.
Note that here we are using
127.0.0.1. It’s fine, later on we will use an SSH tunnel to redirect the traffic from port 9000.
Configuring PHPStorm
Creating a new empty project
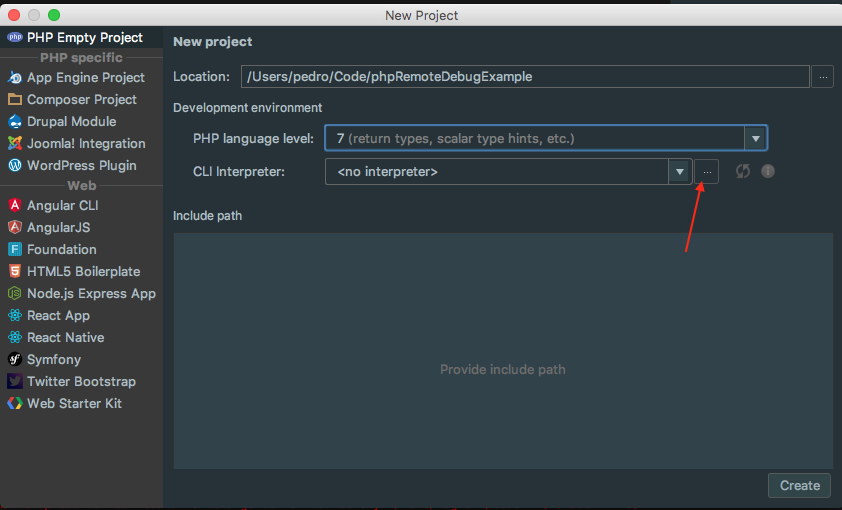
Now we will need to configure some bits in PHPStorm. First of all we will need to create a new empty PHP project. In this new project, we will need to use the remote CLI interpreter on the server. Click on the ... as it is shown in the following screenshot:
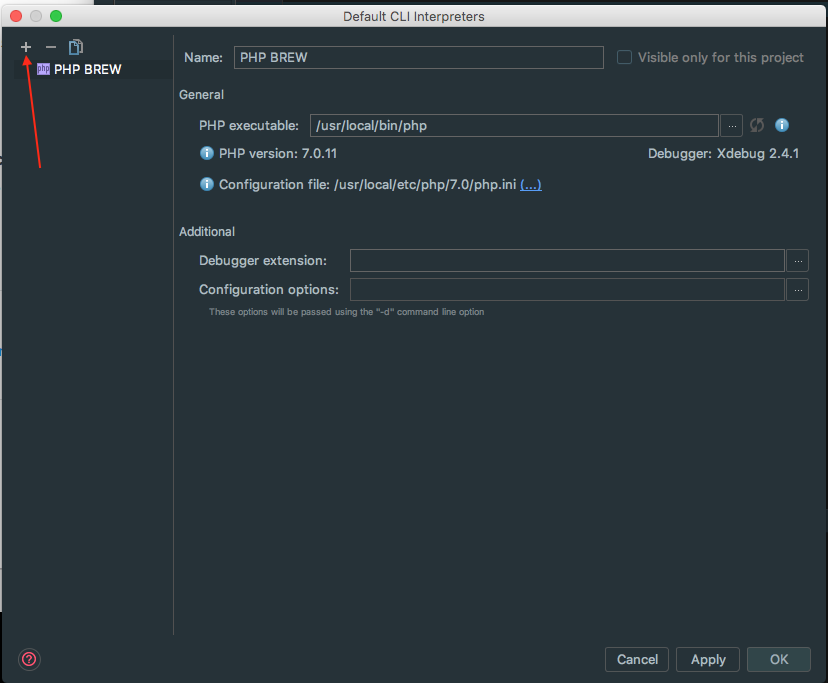
In the Default CLI Interpreters window, click on the + button:
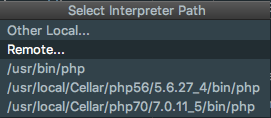
Then you will be greeted with some options. We will need to select the Remote... option:
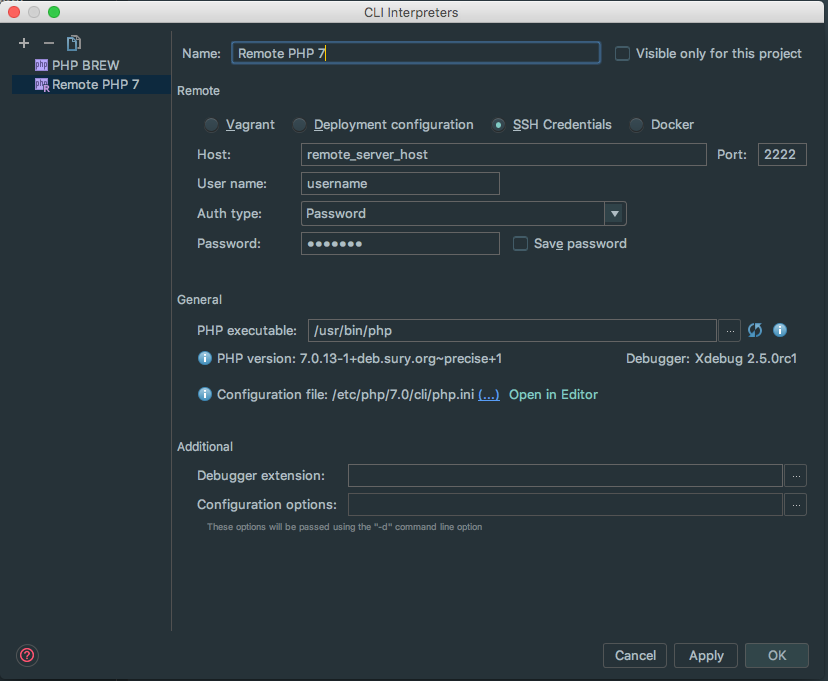
In the Configure Remote PHP Interpreter window, select the SSH Credentials option, and fill the blanks as it is shown below:
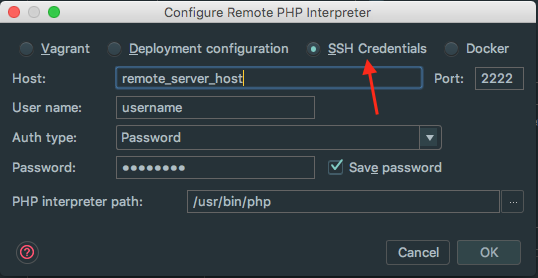
| Host | The host of your remote server |
| Port | The port used to connect to your remote server via SSH |
| User name | Username used to connect via SSH |
| Auth type | Password |
| Password | Password used to connect via SSH |
| PHP interpreter path | The path in the server where PHP executable is, normally /usr/bin/php |
Now, your Default CLI Interpreters configuration should look like this:
We then click on the OK button in the right-hand bottom corner, and our New Project window should look like this:
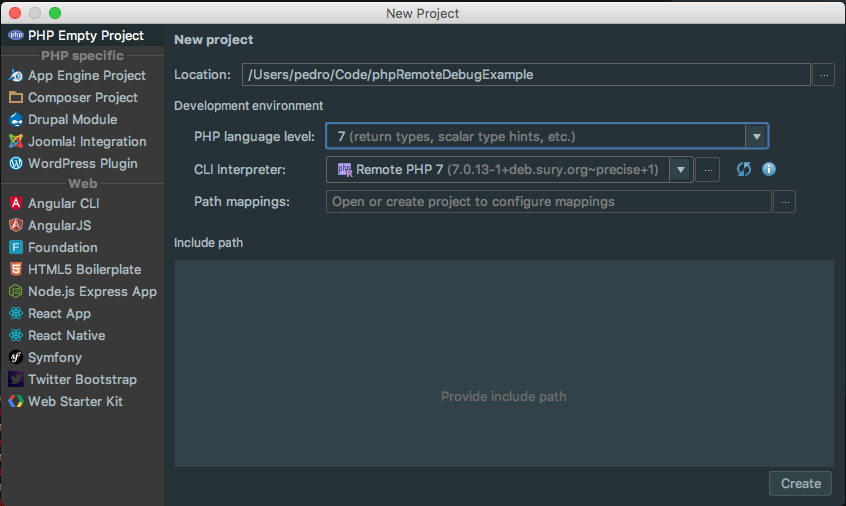
Finally, click on the Create button.
Deployment & Mapping configuration
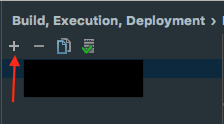
Now we need to setup our deployment and mapping configurations. To do this, we need to open the PHPStorm preferences and go to Build, Execution, Deployment > Deployment, and click on the + button as it is shown in the screenshot below:
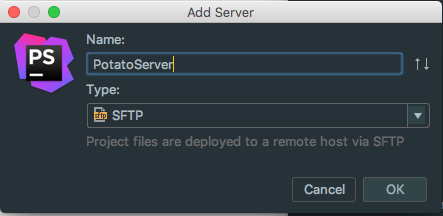
This will open the Add Server window. Specify a relevant name, and set the type option to SFTP. After this, click on the OK button.
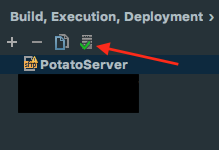
With this complete, we will click on the icon  to set it as a default deployment server for this project. Then the name of the server will be shown in bold:
We then need to configure the connection as follows:
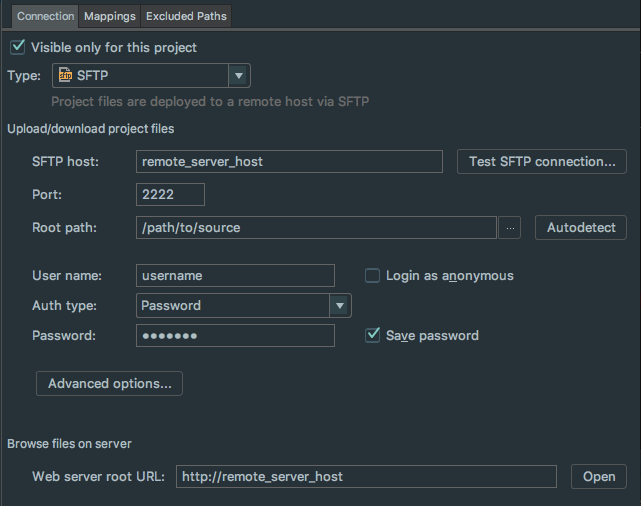
| SFTP Host | The host of your remote server |
| Port | The port used to connect to your remote server via SSH |
| Root path | The path where our code is hosted in the remote server |
| User name | Username used to connect via SSH |
| Auth type | Password |
| Password | Password used to connect via SSH |
| Web server root URL | Just the root of the web server (this one is optional, and not really required) |
The next step is to configure the mappings. Click on the Mappings tab, and fill in the blanks like so:
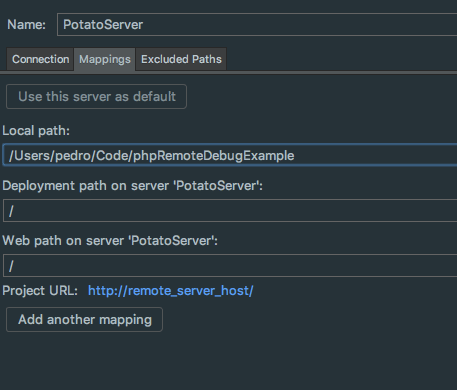
| Local path | This is the path of the project you just created |
| Deployment path on server ‘PotatoServer’ | Path to the sources in your remote server, in this case ‘/’ because we set the path to our source in the Root path field in the previous tab |
| Web path on server ‘PotatoServer’ | Just the web path on the server (not really necessary for debugging) |
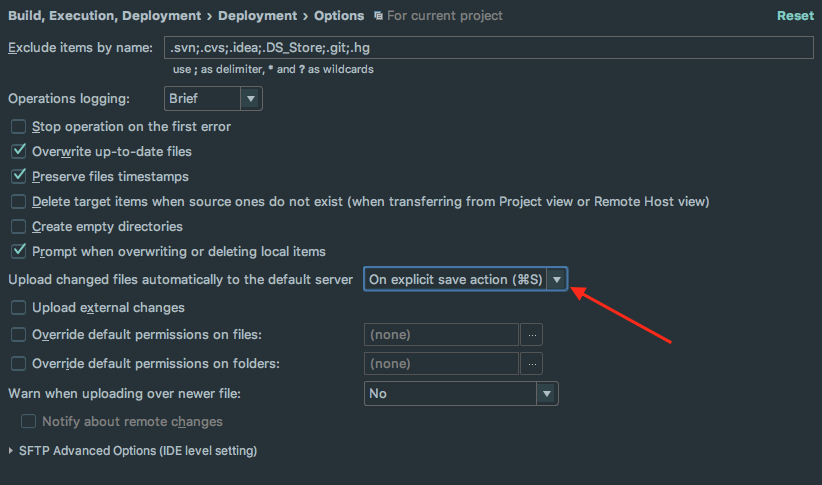
Now, in the PHPStorm preferences, go to Build, Execution, Deployment > Deployment > Options, and select the option On explicit save action. This will upload the given file to the server after explicitly saving it.
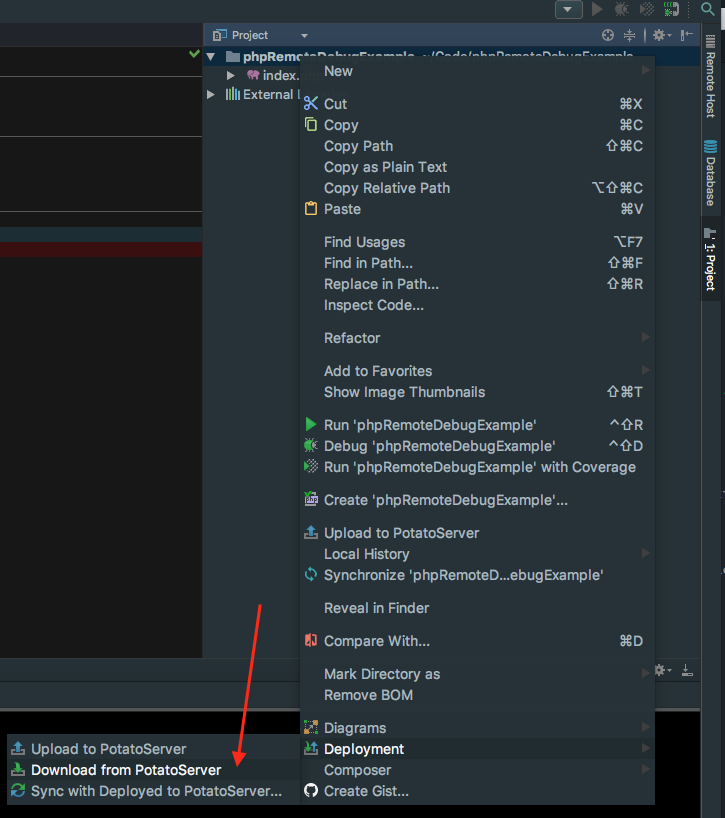
Click on the OK button and go to the Project View. Right-click on the project root folder and select the option Deployment > Download from PotatoServer:
You will find that the files hosted within the deployment path on server are now copied into the local path we specified.
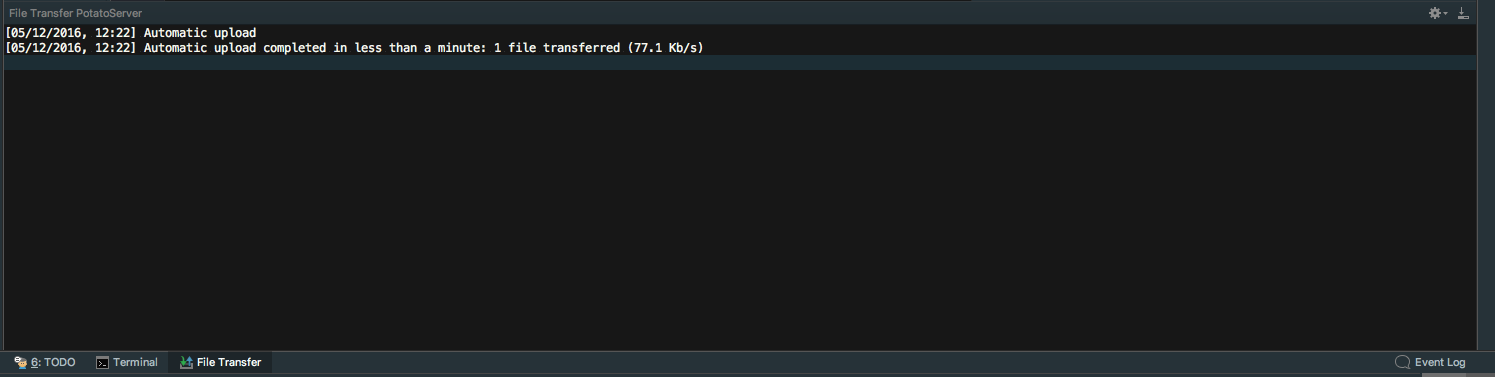
Now, if you modify a file and save it, you will see that a new panel will appear with the file transfer information.
Note that we need to explicitly save the file in order to upload it to the server.
Debugging
Open an SSH tunnel
Now that we have everything configured, we will need to open a SSH tunnel and set up port forwarding for port 9000 (or the one specified in the xdebug.ini file) to connect to your remote server. You will need to have this tunnel open in order to debug with PHPStorm.
What we want to do is connect to the remote machine over SSH and setup port forwarding for port 9000 (Xdebug) or port 10137 (Zend Debugger). The idea is that we create a “virtual” TCP port on the remote server that sends its traffic to a TCP port on our own machine, tunneling traffic over SSH.
To do this, we will need to type the following into the terminal:
$ ssh -R 9000:localhost:9000 username@remote_server_host -p remote_ssh_port
| username | Username to connect via SSH |
| remote_server_host | Host for the remote server |
| remote_ssh_port | Port used to connect via SSH |
When this has successfully connected, you do not need to do anything else, just leave the SSH tunnel open.
Listen for PHP debug connections
Now we need to start listening for PHP debug connections in PHPStorm, to do so click on the phone icon  and turn it on
  .
.
Hit the breakpoint
Place a breakpoint in your code, in a place you know for sure will be executed.
You will notice that PHPStorm will prompt us with an incoming connection dialog that we need to accept before carry on. This normally only happens the first time after setting up the configuration.
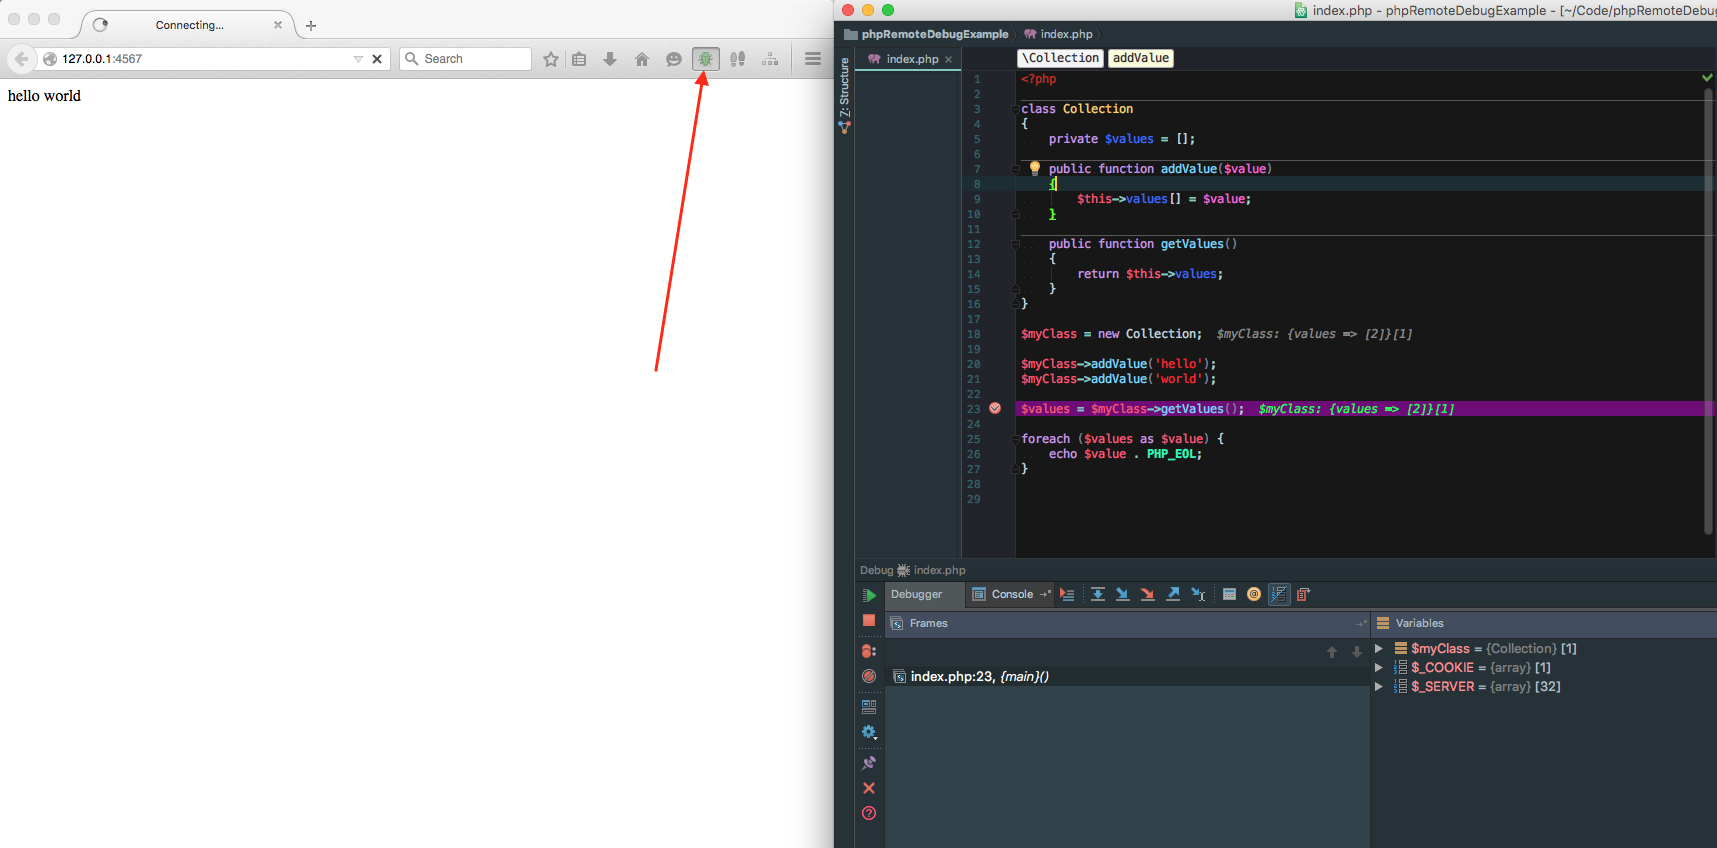
Using it within Chrome
Install the Xdebug helper extension for Chrome.
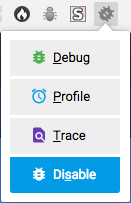
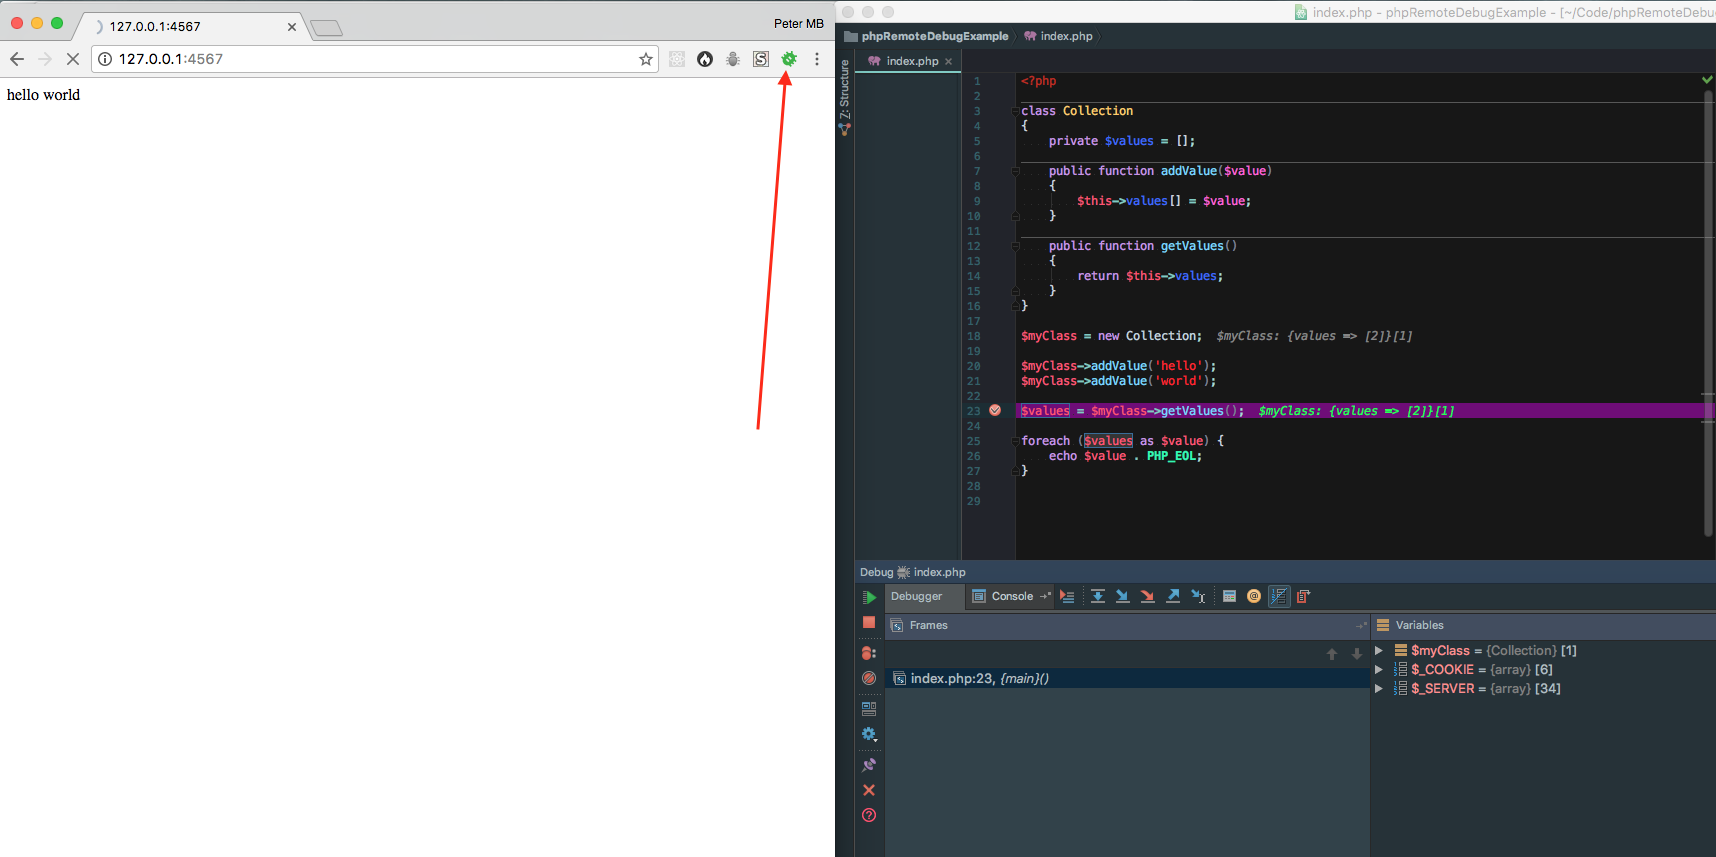
Once installed, click on the bug button  and select the Debug option from the drop-down, then the icon will turn green. Access the page you want to debug and the execution will stop at the specified breakpoint. Select the Disable option to turn it off, to stop debugging.
Using it within Firefox
Install The easiest Xdebug extension for Firefox.
Once installed, click on the bug button  , then the icon will turn green. Access the page you want to debug and the execution will stop at the specified breakpoint. Turn it off to stop debugging.
Using the command line
Connect via SSH to your remote server (you can use the already open connection used for the tunnel), and execute the script.
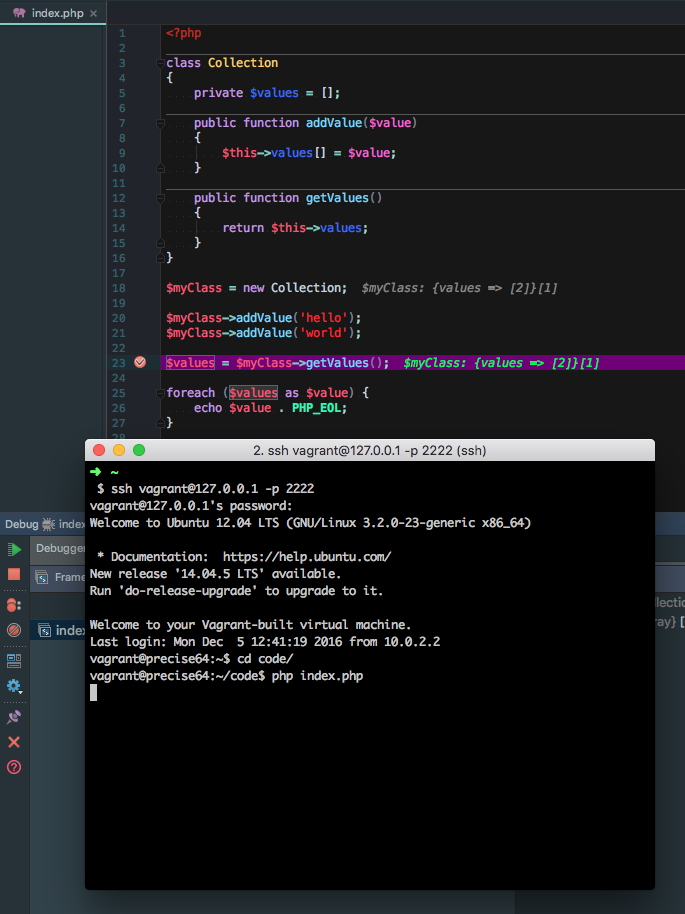
And that’s it, Happy debugging!