
Posted by Pedro Sanchez on Nov 23, 2016
Make PHPStorm your new home - Configuring and using Xdebug locally
We assume that you use PHPStorm on a daily basis, and this guide will help to debug your code locally using the IDE. A remote debugging guide is available, but we strongly recommend going through this one first as it explains the very basics of debugging.
Intuition and hunches are great— you just have to test them out. When a hunch and a fact collide, the fact wins. The values of the variables are never wrong.
The 10 Truths of Debugging
Well, after this epic quote, let’s get to the debugging.
Installation
We use Homebrew to install and manage all the tools and dependencies, so you will need to check which php bin executable you are using. In this tutorial we assume that you have it installed and configured.
First thing we need to do, is to check which php version we are using. Open a terminal window and type:
$ php -v
Depending on your php version, you will need to match the version to install Xdebug: php56-xdebug or php55-xdebug… in our case we have PHP 7.0 installed, so we need to type the following into the terminal:
$ brew install php70-xdebug
Configuration
We need to go to PHPStorm > Preferences > Languages & Frameworks > PHP > Debug and set up the debugger options. The highlighted part is the one we care about at the moment. We need to set up the following actions as it’s shown in the image.
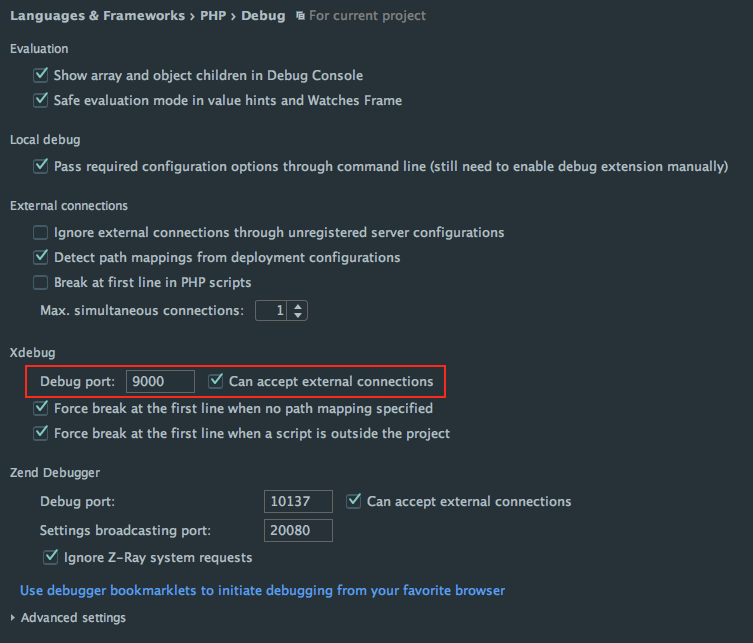
| Debug port | 9000 |
Should match with the remote_port we will specify soon |
| Can accept external connections | Yes |
Enables PhpStorm to accept any incoming connections from Xdebug |
After doing all of this, we need to set and export a variable within our shell profile. On the terminal window type:
If you use zsh:
$ vim ~/.zshrc
If you use bash:
$ vim ~/.bash_profile
And add this on a new line anywhere in the file:
export XDEBUG_CONFIG="remote_enable=1 remote_mode=req remote_port=9000 remote_host=127.0.0.1 remote_connect_back=0"
Note that the value of
remote_portis9000, the same we specified in the PHPStorm configuration
Then in your terminal, just type:
If you use zsh:
$ source ~/.zshrc
If you use bash
$ source ~/.bash_profile
Basic debugging
To show some of the most basic debugging options we will use this code:
<?php

// debug-example.php

class Collection
{
    private $values = [];

    public function addValue($value)
    {
        $this->values[] = $value;
    }

    public function getValues()
    {
        return $this->values;
    }
}

$myClass = new Collection;

$myClass->addValue('hello');
$myClass->addValue('world');

$values = $myClass->getValues();

foreach ($values as $value) {
    echo $value . PHP_EOL;
}
To start a basic debugging session, we need to do just two simple things. First of all, we need to click on the telephone icon in the top right-hand corner of the IDE. This will allow the IDE to start listening for debug connections.
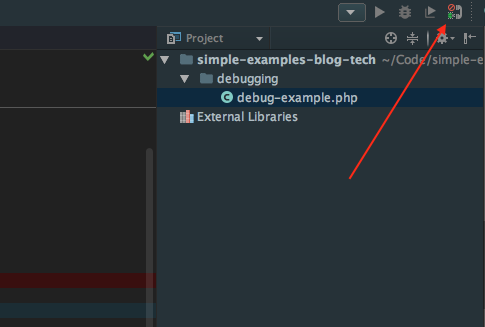
After clicking on it, the icon will change to have a green wave  instead of a red sign
  .
.
Next thing we will do, is to put a breakpoint within our code. You can do that by making a single-click right next to the line numbers. Then a red balloon will appear, indicating that when reaching that point, the debugger will stop the execution.
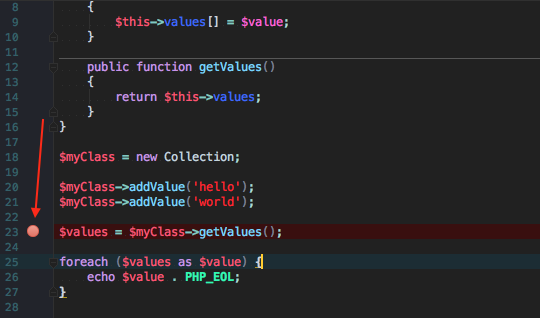
And then, when we run our script, the execution should stop exactly on the breakpoint:
$ php debug-example.php
In this example, we just run a php script manually, but this will work as well with a server running locally. As long as the breakpoint is reached on the execution, the IDE will stop there.
Debugger tab
As we can see in this section, we will find some different options we can use. We will focus only on the most basic ones:
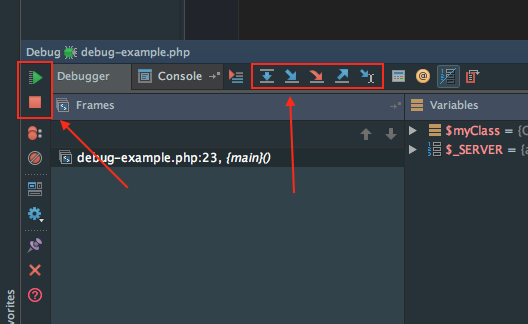
On the left-hand side, from top to bottom:
 Resumes the execution until the next breakpoint is found (if there is any)
 Stops the debugging session on the current breakpoint
On the top, from left to right:
 Step to the next line on this file.
 Step to the next line executed (If the execution point is on a function or method call, this will step into the function)
 Step into, ignore stepping filters for libraries, constructors, etc.
 Step to the first line executed after returning from this method
 Run to the line the caret is placed at. Note this does not work backwards…
Also we will find three main sections on the Debugger tab:
Frames
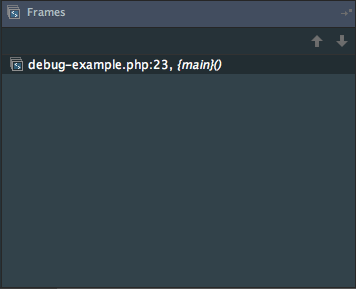
In this part, you can navigate through the stack trace of the execution. If we click on a execution point, our caret will move to that execution point, and you can navigate back through all the path the code took to see where this is coming from.
You can check it if you put a breakpoint inside the addValue method in our class. Then, when we execute the code, the IDE will stop the execution right there. You will see that you will have something like the following in your stack trace:
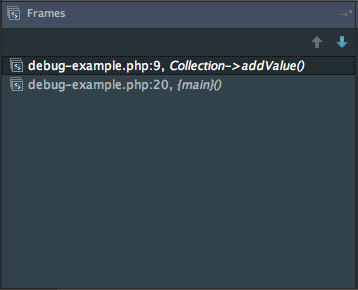
If you click on the first line, the caret will place on the breakpoint you just set, which is on the line number 9 of our script. However, if you click on the second line, the caret will place on the line where the value is added to our Collection class, on the line number 20. This is really useful to trace back the execution and find potential problems that are obscure or not too obvious at first sight.
Variables
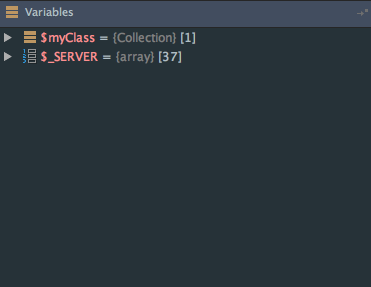
Here you will be able to navigate through the variables. Note that when stepping to other execution points, some variables will change their colour to blue (this may change depending on the theme you have). That means that the variable changed it’s value since the previous step, or is a new one that just have been created.
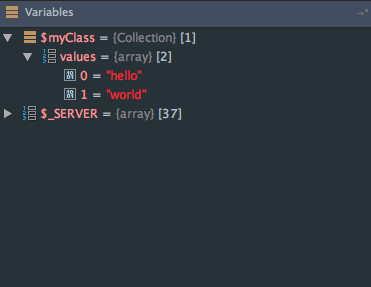
As it’s shown in the image above, you can navigate very easily through your variables and see what’s inside.
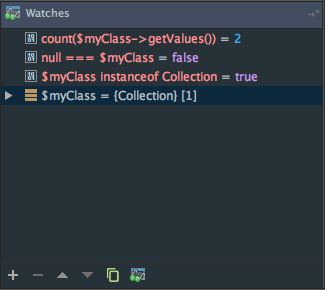
Watches
![]()
Here we can drag & drop some variables from the variables tab that may require more attention. Also, you can type expressions there like ($a === $b) and retrieve the result, or invoking a method $a->someMethod().
Console tab
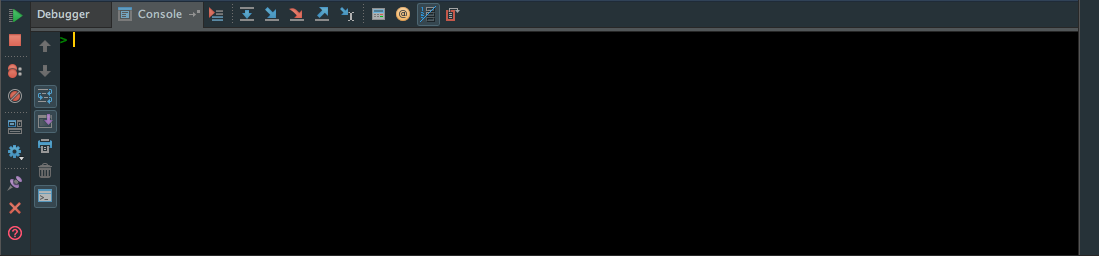
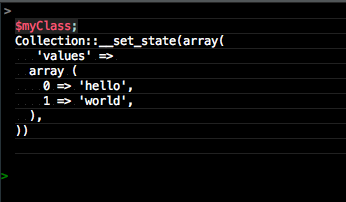
A simple thing to do is just to type the name of a variable and see a var_dump (ish) output:
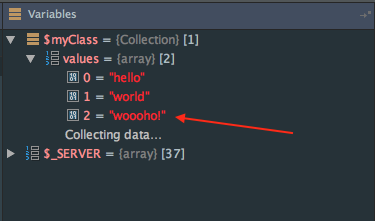
Here we can even change the value of the variables. This is extremely useful if we want to test the behaviour of some parts of our application based on certain situations. In this case, we will add a new value to the collection:
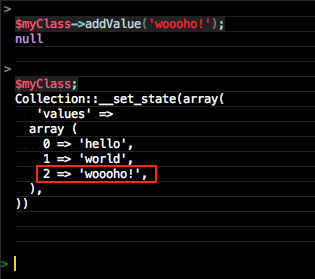
And then you will be able to see it in the Variables section within the Debugger tab:
Additional notes
Note that you must put the breakpoint on a line containing some code. If you try to put it on a comment or an empty line, the breakpoint won’t be set.
Also, there are some certain situations where PHPStorm will allow us to put a breakpoint, but the execution won’t stop, like in this case:
<?php
$someArray = [   // a breakpoint set in this line won't stop the execution...
    'hello',     // ...but here will do! :)
    'world'
]
Another thing to have in mind is that you will be able to see only the values on the Variables section found BEFORE the execution point.
<?php
$hello = 1; // at this point, you won't see the $hello variable on the Variables section
echo $hello; // but here, we will be able to see it on the Variables section
And that’s all! Now you can start debugging like a boss :).